


Quincunx Simulations—Part 1
In the mid-19th century, Francis Galton introduced the ideas and tools of regression and correlation to the world, derived from his studies of inherited characteristics.
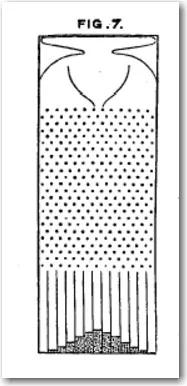
To help his thinking and explanations, he built an analog simulation device, called the Quincunx. The picture at left is from Galton’s lucid description of the Quincunx on pp. 63-65 of his book Natural Inheritance (available in facsimile at http://galton.org).
The device consists of a chamber at the top that holds small metal balls and a funnel that directs the balls to drop through a field of pins, symmetrically placed.
Quincunx is simply a Latin word for five points, referring to the pattern of the pips representing the number five on a common six-sided die. This pattern, repeated, gives the field of pins in the device.

As the illustration from Galton’s book shows and Galton explicitly observed, the balls falling through the field of pins will pile up in a shape that looks like a “normal” distribution.

Dr. Rob Stiratelli taught me to use a Quincunx model slightly different from Galton’s version—Rob’s modern version, pictured at left, has a funnel that an operator can move left or right, changing the aim of the dropped bead. The operator of the modern Quincunx also can drop one bead at a time rather than dumping a whole collection at once as in Galton's model.
Rob used the Quincunx to help people understand the difference between special and common causes of variation.
While these two types of variation are the basis for control charts, Rob’s exercise aimed to get people to grasp the essence of acting rationally when faced with system results that vary.
Rob’s exercise poses a challenge: maximize the number of beads that fall in a specific five consecutive slot range. That’s not too hard to do if you can see the funnel and get the funnel aimed at the middle of that range. Given ten rows of pins and a funnel centered correctly on the center of the range in the Quincunx pictured here, you will consistently achieve at least 16 out of 20, and frequently 18 of 20.
But Rob made things more difficult, with two twists.
First, he covered up the front of the Quincunx. The only thing the audience could see was the bottom row of the display, where the slots were numbered. A five slot target range could be numbered 48 to 52.
To give people a little help, Rob described the position of the funnel, by means of a “meter value” in 1:1 relationship with the position.
The exercise starts with the funnel centered at the low end of the target range. In the set up I've used for years, the initial funnel position corresponds to a meter value of 30. Move the meter to 32 and the funnel will be centered at the middle of the target range.
Rob added one more twist. After the first 20 beads are dropped, he surreptitiously offset the funnel position—slipping the funnel left or right 3 positions, without telling the audience (remember, the Quincunx’s funnel is hidden from view.)
For example, at the beginning of the second round of 20 bead drops, a meter value of 30 will now point the funnel at outcome slot 45. At the beginning of the third round of 20, Rob slipped the funnel left or right 4 positions.
Teams are often confused by the offset, which mimics the fact that human-engineered systems never behave the same for long without regular maintenance and attention. How should managers respond? There’s a tension between calling for an adjustment when the funnel is stationary (variation from the pins only) and waiting too long to make an adjustment for a system that has moved off target—either way on average leads to a lower total score.
I’ve continued to use Rob’s exercise with my clients.
In the next post, I’ll summarize the results from a training class running next week and link to the workshop materials I’m using.
Computer Simulation or Physical Device?
You can buy a version of Galton’s device (e.g. http://www.qualitytng.com/). I am fortunate enough to own three of these devices, a legacy from a Ford Motor Company training project a number of years ago.
The R statistical language has a package animations that includes a Quincunx simulator. I thought about using that simulator for Rob’s exercise but it turned out to be easier to build my own version, as a Shiny app. I’ll use it for the first time in public next week at the training class and then post the code to GitHub.
I like having a physical Quincunx in class though it is heavy and awkward to transport.
Here’s why:
The physical version allows you to easily make changes to the system to see what happens—tilting the device or blocking off channels in the pin block with tape or paper. These changes are easy for anyone to see, requiring no knowledge of R code.
More importantly, the physical device provokes a discussion of why the outcomes of the beads dropping through the pins vary. Usually, someone in the class will say “it’s just random variation”, which allows us to ponder the difference between math models of a system and the system itself.
That’s an important lesson any day but perhaps particularly so this month in the aftermath of our recent U.S. national election.

