Process Flowcharts and Value-Stream Maps: Distinction with a Difference

Shigeo Shingo prefaces his analysis of the Toyota Production System with the distinction between process and operations. (A Study of the Toyota Production System From an Industrial Engineering Viewpoint, Revised Edition 1989 Productivity Press, Cambridge, MA, chapter 1).
“When we look at process, we see a flow of material in time and space; its transformation from raw material to semi-processed component to finished product. When we look at operations, on the other hand, we see the work performed to accomplish this transformation—the interaction and flow of equipment and operators in time and space.”
Shingo recommends that proper analysis will maintain the distinction. To make effective progress, we should resist the temptation to collapse the two aspects into a single analysis and a single diagram.
He then gives his recommendations for process improvement and operations improvement (chapters 2 and 3).
The order of the chapters matters: pay attention to process flow first. Process improvement may lead you to get rid of operations that exist now related to inspection, transportation, and management of delays—there's no need to study operations that you can elimnate!
Shingo’s process-operation distinction underpins Rother and Shook’s introduction to value-stream mapping.
What's a value stream?
“A value stream is all the actions (both value creating and nonvalue-creating) currently required to bring a product through the main flows essential to every product: (1) the production flow from raw material into the arms of the customer, and (2) the design flow from concept to launch.”
(Learning to See: Value-Stream Mapping to Create Value and Eliminate Muda (v 1.4, 2009), by Mike Rother and John Shook, LEI , Cambridge, MA, p. 1).
A value-stream map shows how value is created through specific actions; drawing a value-stream map focuses your attention on the flow (and barriers to flow) to create value, not the details of the actions themselves (the operations).
In line with Shingo’s recommendation, a value-stream map is the starting point for analysis—to focus attention on value creation and the speed bumps and pot-holes that prevent perfect flow.
In most organizations, the barriers to perfect flow can only be removed by management action—the people working within process steps don’t have the responsibility or authority to design and deploy flow improvements.
Rother and Shook present a useful schematic that tells this story.
The schematic shows responsibility for flow kaizen (value-stream improvement) mostly belongs to senior management while responsibility for process kaizen (elimination of waste in operations) mostly belongs to “front lines”—staff and first-level supervision who carry out the operations that create value.

Figure reproduced from Rother and Shook, p. 6.
Connection to the Model for Improvement
The first question of the Model for Improvement is “What are we trying to accomplish?” That is, what is our aim?
It’s easy to overlook this question; when I don’t have a clear answer to this question, my work and service to my clients always suffers.
From a lean perspective the general improvement aim for any production systems is: increase value as defined by the customer, product by product.
(See for example Womack, James P and Jones, Daniel T. 2010, Lean Thinking: Banish Waste and Create Wealth in Your Corporation, Free Press. Kindle Edition, Introduction: Lean Thinking versus Muda. Womack and Jones propose five principles that give a roadmap for lean application.
“[1] precisely specify value by specific product, [2] identify the value stream for each product, [3] make value flow without interruptions, [4] let the customer pull value from the producer, and [5] pursue perfection.” (p. 10))
The value-stream map helps us to keep the aim in mind as we plunge into improvement details. An appropriate value-stream map is a key tool in applying Model for Improvement thinking to production systems.
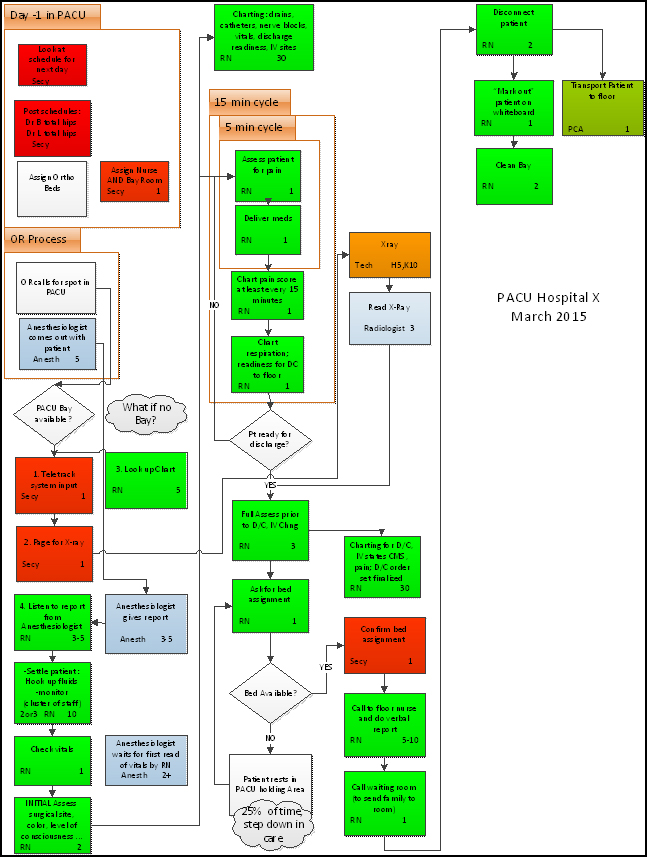
For example, in the map at the start of this post, what value does the post-acute care unit (PACU) provide to a patient who has just emerged from elective knee or hip replacement surgery?

In the PACU example, the value-stream map helps the manager and staff focus on work to have patients pain-free and ready to begin recovery in the in-patient care unit.
Waiting for service, poor management of pain and variation in recovery readiness detract from the flow of value. Before we spend a lot of time and effort to investigate and modify specific operations, what can we do to decrease waiting, improve pain management and drive consistency in readiness to begin recovery?
Process Flow Chart
Here’s a view of the same post-acute care unit in a process map, with the steps in sequence. It also shows resources identified by color and typical number of minutes needed by each resource. It's tempting to jump to this level of detail in efforts to improve performance before working on the value-stream map. That’s a mistake—it’s too easy to lose sight of the aim of the care cycle and start chasing variation and details that may or may not effectively improve value.
While we need to understand the details of operations to remove waste, waste is only defined in terms of activity that does not add value.
Without a definition of value, it’s hard to see waste and act to remove it. In fact, the odds are pretty high that we will not use our limited time and capacity well if we don’t have a good understanding of what we are trying to accomplish.