Pandemic Data Science: Insights to Guide Our Work

The Covid pandemic has elevated data problems and methods into public view.
How can leaders in governments, businesses, non-profit organizations, religious communities, neighborhoods, and families figure out what do to? Regularly reported data on cases, hospitalizations and deaths feature inconsistent definitions and delays. Models based on these data present summaries and short-term predictions that are inconsistent.
If we could ignore the fear, illness, death and the social and economic disruption associated with managing the Covid pandemic, this would be a pure happy time for those of us who use and apply data science methods and tools. Many challenges, abundance of numbers, and a wealth of opportunities to collaborate with colleagues!
I am trying to learn fast to understand how a range of statistical methods and visualizations might help people make better decisions as they assess whether relevant Covid numbers are ‘better’ or ‘worse’.
Coming up for air as I try to understand methods that I have not used before, I keep returning to a short list of data science insights that I have repeated to myself and shared with friends and colleagues in the last ten weeks:
You can see a lot by looking (Yogi Berra).
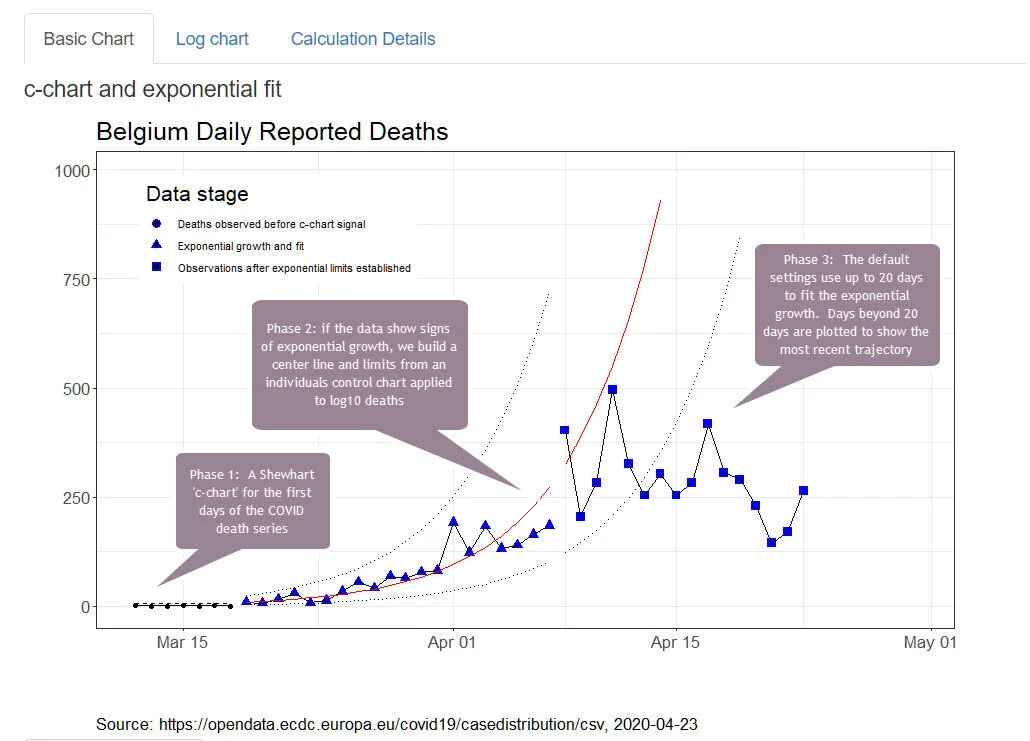
All models are wrong; some are useful (George Box). George’s point has been repeated many times in the past 12 weeks by many people!
An approximate answer to the right question is better than an exact answer to the wrong question (John Tukey).
The more you understand what is wrong with a figure, the more valuable that figure becomes (William Thompson, Lord Kelvin).
There are three ways to get better numbers: Fudge the numbers, distort the system, or improve the system (Brian Joiner). More on Brian’s insight here.
Systems Thinking
Brian’s insight connects data science to systems thinking.
If I had only one system thinking tool to carry with me, I’d take The Model for Improvement developed by Associates in Process Improvement.
The Model for Improvement asks three questions, starting with ‘what are we trying to accomplish?’
To make progress towards an aim, the Model for Improvement asks two more questions. How will you know that a change is an improvement? What can you change can you make that will result in improvement?
Now link the answers to the three questions to a cycle that tests and studies the change(s): plan, do, study, act. Test on a small scale, be prepared for surprises and be ready to modify what you thought you knew.
In the next post, I’ll share notes I drafted to help colleagues think about a measurement system to monitor Covid data. I used this post’s insights to shape my advice.