


Applying the Kelleher Rule to Improve Improvement Projects
My friend and colleague Kevin Kelleher, principal at BMGI, taught me a rule of thumb 25 years ago. I call it the Kelleher Rule:
Collect data on key system or process properties “one step” faster than your capacity to make decisions and interventions using those data.
Kelleher’s rule suggests that if you have time to reflect and act weekly—that is, you can carry out a Plan-Do-Study-Act cycle weekly in your management of the system or process--then you should collect some data every day.
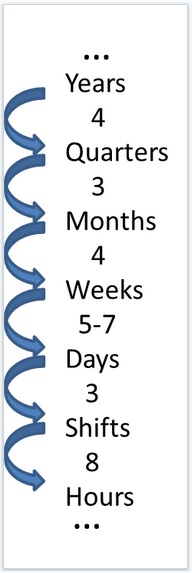
The sketch at left shows typical time steps, which are separated by a factor of about 4, as you read down the scale.
When you track numbers in a table or add dots to a plot, a daily value gives you a sense of trends or shifts within the week, especially if you have past weeks for reference. This is the logic behind use of specific rules for run charts.
It’s also usually a good idea not to react to a single data point unless the single point is very unusual. Control charts are one class of tools to judge whether an individual point is unusual enough to justify a rational response through detective work and action.
Prospectively, if you make a change to the system or process, you’d like to have evidence that the change is working or not relatively quickly—and quickness again is relative to your management capacity. If you have a weekly management stand-up review meeting and make a change on Monday, Kelleher’s rule guides you to get data daily to assess impact of your change to inform next week’s review.
There’s a psychological aspect of data and action, too. It seems that the frequency of observation can stimulate a response—several observations can overwhelm my inertia and denial or ignorance, prodding me to reflect and then maybe even act to make things better. That is, awareness and signals from the environment can prime the pump for change.
Sending the Wrong Message
I thought about Kevin’s rule this week as I built a reporting template for an improvement collaborative. The collaborative aims to improve oral health for kids; we’re working with 20 dental clinics in community health centers across the U.S.
Like many improvement collaboratives I’ve seen, the reporting template uses months as the time step: in a spreadsheet, we have several columns of measures and every row in the sheet is a month.
The participating teams will send in their templates every 30 days; we’ll use a web app I built in R and shiny that will collate the numbers and make sets of “small multiple” run charts. (I’ve posted examples of Shiny apps here and here.)
The web display will help us understand progress and identify teams that look like they’re making exceptional progress, our “bright spots.”
Now, we intend that improvement teams will test changes to improve system or process performance much more frequently than once a month. However, in my experience the monthly reporting cycle often superposes a monthly rhythm on the project work that can delay progress.
The inverse of the Kelleher Rule—i.e. if I collect data once a month, then my management plan-do-study-act work just has to happen quarterly—is a disaster.
My interim conclusion: in the oral health collaborative, I have to help participants decouple the monthly rhythm represented in the project reporting template from the testing and management action cycles. The improvement teams will need daily and weekly data to learn and improve; the monthly report should not dictate project pace.
Connection to Lean Thinking
The initial application of Lean methods occurred in mechanical fabrication and assembly operations, starting with Toyota decades ago. Getting value to flow in fabrication and assembly directly translates to “one-piece” flow of fabricated part or assembled component. Mass (batch) production—characterized by bunches of materials and parts staged ahead of each operation that requires picking up, putting down, waiting, and tracking where stuff is at any given point—has enormous levels of waste.
What would application of one-piece flow and elimination of batch processing thinking mean for my collaborative improvement project?
It looks like we should avoid batching our project management into monthly buckets. We should drive to smaller and smaller chunks of time for our Plan-Do-Study-Act cycles.
As a consequence, since we ought to be able to work to weekly or twice-weekly management in the dental clinics, we should seek daily or half-day data to inform progress and not be fooled by the monthly report.

