


Process Perfection

One of my clinical improvement projects aims to improve application of sealants to reduce cavities in children (search my blog for sealants).
Clinic teams work to apply sealants to eligible children’s permanent molars whenever they have the child coming for care, often for periodic prophylactic exams in which the clinical team will clean the teeth and examine for other health issues. The target children are aged 6 to 14.
The key steps in the sealant application process look something like this for an individual child in the target age range:
Scan the day’s schedule for the child and alert the clinician to be ready to confirm a need for sealants and to apply sealants as appropriate.
Determine number of teeth eligible for sealants for the child during the exam (could be 0 to 8 sealable molars).
Apply sealants to all eligible teeth.
Document the teeth sealed during the visit.
How well does this sealant process perform?
At each step, ask the perfection question: “Does the step operate perfectly?”. If perfect, patient and care team co-produce the step’s desired result using the right level of time and other resources. Using answers to the perfection question, we can characterize process perfection by arithmetic and the logic pictured in the tree diagram at the top of this post.
Think of a patient moving through the four steps in the diagram. There’s a chance of taking the upper fork or the lower fork at each step. What is the chance that the patient moves through all four steps, always taking the upper fork? We use a multiplication rule: multiply the chances of perfection at each step.
The multiplication rule reveals the challenge of process performance: If each of the four steps produces perfect results 90% of the time, the overall process only produces perfection about 66% of the time, as .9 x .9 x .9 x .9 ≈ .66
Now we don’t usually need perfection in many processes in healthcare, as Roger Resar argues in this post on the IHI website. Roger says 95% reliability is a pretty good initial target; 95% performance typically means that you have management methods in place to sustain good performance over time.
Calculation of the level of perfect process performance gives you a clue about what to do to improve performance. If your process perfection level is less than 80%, that is a strong indication that you need to start with or revisit the basics:
(1) Draw and describe a standard sequence of operations to perform each step;
(2) Assure people know the operations and can perform them; do you have ways to help new people learn to do the work correctly?
(3) Provide feedback on performance; emphasize direct observation and manual tallies rather than monthly computerized reports.
If your process perfection number is 80 to 90%, you’re ready to explore ways to error-proof and further simplify the process to make the perfect way the easy way to work. The original IHI whitepaper on reliability has additional useful suggestions.
Technical Notes
Calculation of Perfect Performance
Perfection is represented by the upper edge of the diagram: the path from step 1 to the result after step 4, where we have marked + to indicate a positive answer to the perfection question.
In symbols, let S1+ stand for the event “perfect operation at step 1”, corresponding to the + arrow emerging from Step 1.
Working along the upper edge, we have three more arrows, which correspond to these three events: {S2+ given S1+}, {S3+ given S2+ and S1+}, and {S4+ given S3+, S2+ and S1+}.
We want the probability of the path of four positive arrows on the upper edge of the diagram. In symbols, this path is the composite event {S1+ and S2+ and S3+ and S4+}.
Let’s assign a probability of perfect performance to each arrow on the upper edge. This gives four probabilities: P(S1+), P(S2+ given S1+), P(S3+ given S2+ and S1+) and P(S4+ given S3+, S2+and S1+). To make the typing easier, I’ll use the vertical bar | for the word “given”.
The challenge is to link these four probabilities to the probability of the composite event. This challenge is easily met if we recall the definition of conditional probability for two events A and B:
Using the conditional probability rule gives P(S1+ and S2+) = P(S2+ | S1+) x P(S1+).
Now group events from step 2 and step 3 as one event and again apply the definition of conditional probability to the grouped event:
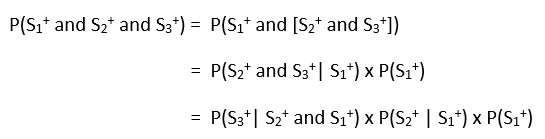
We use the same grouping trick to get the final solution for P(S1+ and S2+ and S3+ and S4+):
Expression (1) looks a bit daunting and a natural question is “how can we calculate all those conditional probabilities?”
Usually, people estimate perfect performance of each step, ignoring dependencies on previous steps. Just multiply to estimate process perfection according to the multiplication rule
That’s a pretty good approach, especially since many processes are shockingly poor at delivering perfect performance consistently.
Justification for the Multiplication Rule
Why can we use the multiplication rule in (2) rather than the complicated expression in (1)? Let’s look at the conditional event S2+ given S1+. The situation for the other conditional events can be analyzed in the same way.
Focus on factor P(S2+ | S1+) in expression (1); the corresponding factor in expression (2) is P(S2+), the probability of S2+ unconditioned on S1+.
Basic probability rules lead to a marginalization equation that highlights the issue:
In a relatively well-managed process, P(S1+) will be close to 1 and Case 1 will hold approximately.
Alternatively, if the process steps are not tightly linked and there is no strong functional relationship between steps 1 and 2, we would expect S2+and S1+ to be statistically independent, which implies P(S2+ | S1+) = P(S2+). This is an instance of Case 2.
Finally, note if by design step S2 cannot occur when S1 fails, then event S2+ is identical to the event {S1+ and S2+} and the marginalization equation correctly reduces to P(S2+ | S1+) x P(S1+).
Rolled Through Put Yield
The perfect performance formula has a version in Six Sigma work called a “rolled throughput yield” (RTY) that also uses the multiplication rule:

