


Bad Outcomes and Delirium
My IHI colleagues and I are working to improve care for older adults through the Age-Friendly Health Systems initiative.
The initiative seeks to spread methods and practices well-known and validated by geriatric specialists to teams in both in-patient and ambulatory settings. The core methods and practices are grouped into four categories, known as the 4M’s: What Matters, Medication, Mentation and Mobility.
Mentation covers prevention, detection and mitigation of delirium, dementia, and depression.
Delirium prevention, detection and treatment is a focus for hospital-based care.
Bad outcomes from delirium?
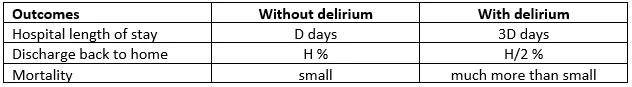
A simple data table we recently reviewed summarized the association of delirium with bad outcomes in one hospital. I don’t have permission to share the specific numbers from the unpublished report; for our discussion, it suffices to consider the relative differences in mean outcomes between the groups of patients with delirium and the patients without delirium.
The data represent many months of records and hundreds of patients; I believe that the differences in means are not explainable by variation arising from small numbers of patients.
The first draft of the table had the title “Delirium has Serious Consequences”. While I don’t disagree with that statement, the data in the table don’t quantify a consequential (causal) link between delirium and outcomes.
Two causal graphs
The title “Delirium has Serious Consequences” might be represented with this causal diagram
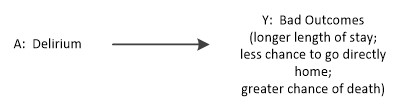
This diagram asserts there are no other factors that account for bad outcomes. The diagram implies that an average causal effect of delirium can be estimated by the difference between the columns of the table. For example, for length of stay, we estimate an average causal effect of delirium as 3D – D = 2D days longer length of stay.
The A -> Y causal diagram matches the structure of a simple idealized randomized experiment, where we give a ‘delirium treatment’ to patients at random and measure the outcome over the group of patients with and without delirium.
Of course, inducing delirium in people is unethical and wasn’t the way the numbers in the data table were generated.
The delirium summary numbers came from observing patients in a specific hospital. A causal diagram that seems more likely to represent the situation at the hospital looks like this:

According to this causal graph, the vector L of patient characteristics affects both the chance of getting delirium and the degree to which outcomes will be bad. We can’t disentangle patient characteristics from delirium itself in the generation of bad outcomes. Delirium experts need to generate the set of relevant patient characteristics, which might include factors like age, prior medical conditions, reason(s) for current hospitalization, and current medications.
This second graph presents the basic picture of “confounding”; in graph analysis terms, there is a “back-door” path between Y and A, which means we can’t use the summary numbers in the data table to directly estimate the causal impact of delirium.
The confounding graph says we need a more refined approach to estimate a causal effect of delirium. Hernán and Robbins outline three model-based methods to generate a causal estimate to deal with confounding: inverse probability weighting, standardization and g-estimation, in chapters 12-14 of Causal Inference. As the graph suggests, these methods require detailed knowledge of the confounding factors in L.
In light of the potential for confounding, we changed the title of the table to “Delirium associated with Serious Consequences.”
Practical application
In the presence of confounding, we should expect the table’s estimate of length of stay for patients with delirium to be biased. Unfortunately, the causal diagram contains no information about the direction or degree of bias.
Colleagues in the age-friendly initiative have developed a business-case calculator to estimate cost savings from prevention of delirium. Two input fields are the average length of stay for patients with and without delirium; let's call these values LOS1 and LOS0. Does our simple table give us any guidance about values for those fields?
If we have not used a method to adjust for confounding prior to estimating the effect of delirium on length of stay, we should consider a range of values for LOS1 shorter than the simple table estimate. Here’s my counterfactual reasoning: if patients who experience delirium are on average ‘more vulnerable’ they would tend to have longer lengths of stay even if they did not experience delirium. Hence the confounding increases the raw length of stay value and we need to adjust LOS1 downward. Equivalently, we could increase LOS0 upward as it is the difference LOS1 – LOS0 that drives the cost impact calculations.

