


Local Focus, Simpler Challenges
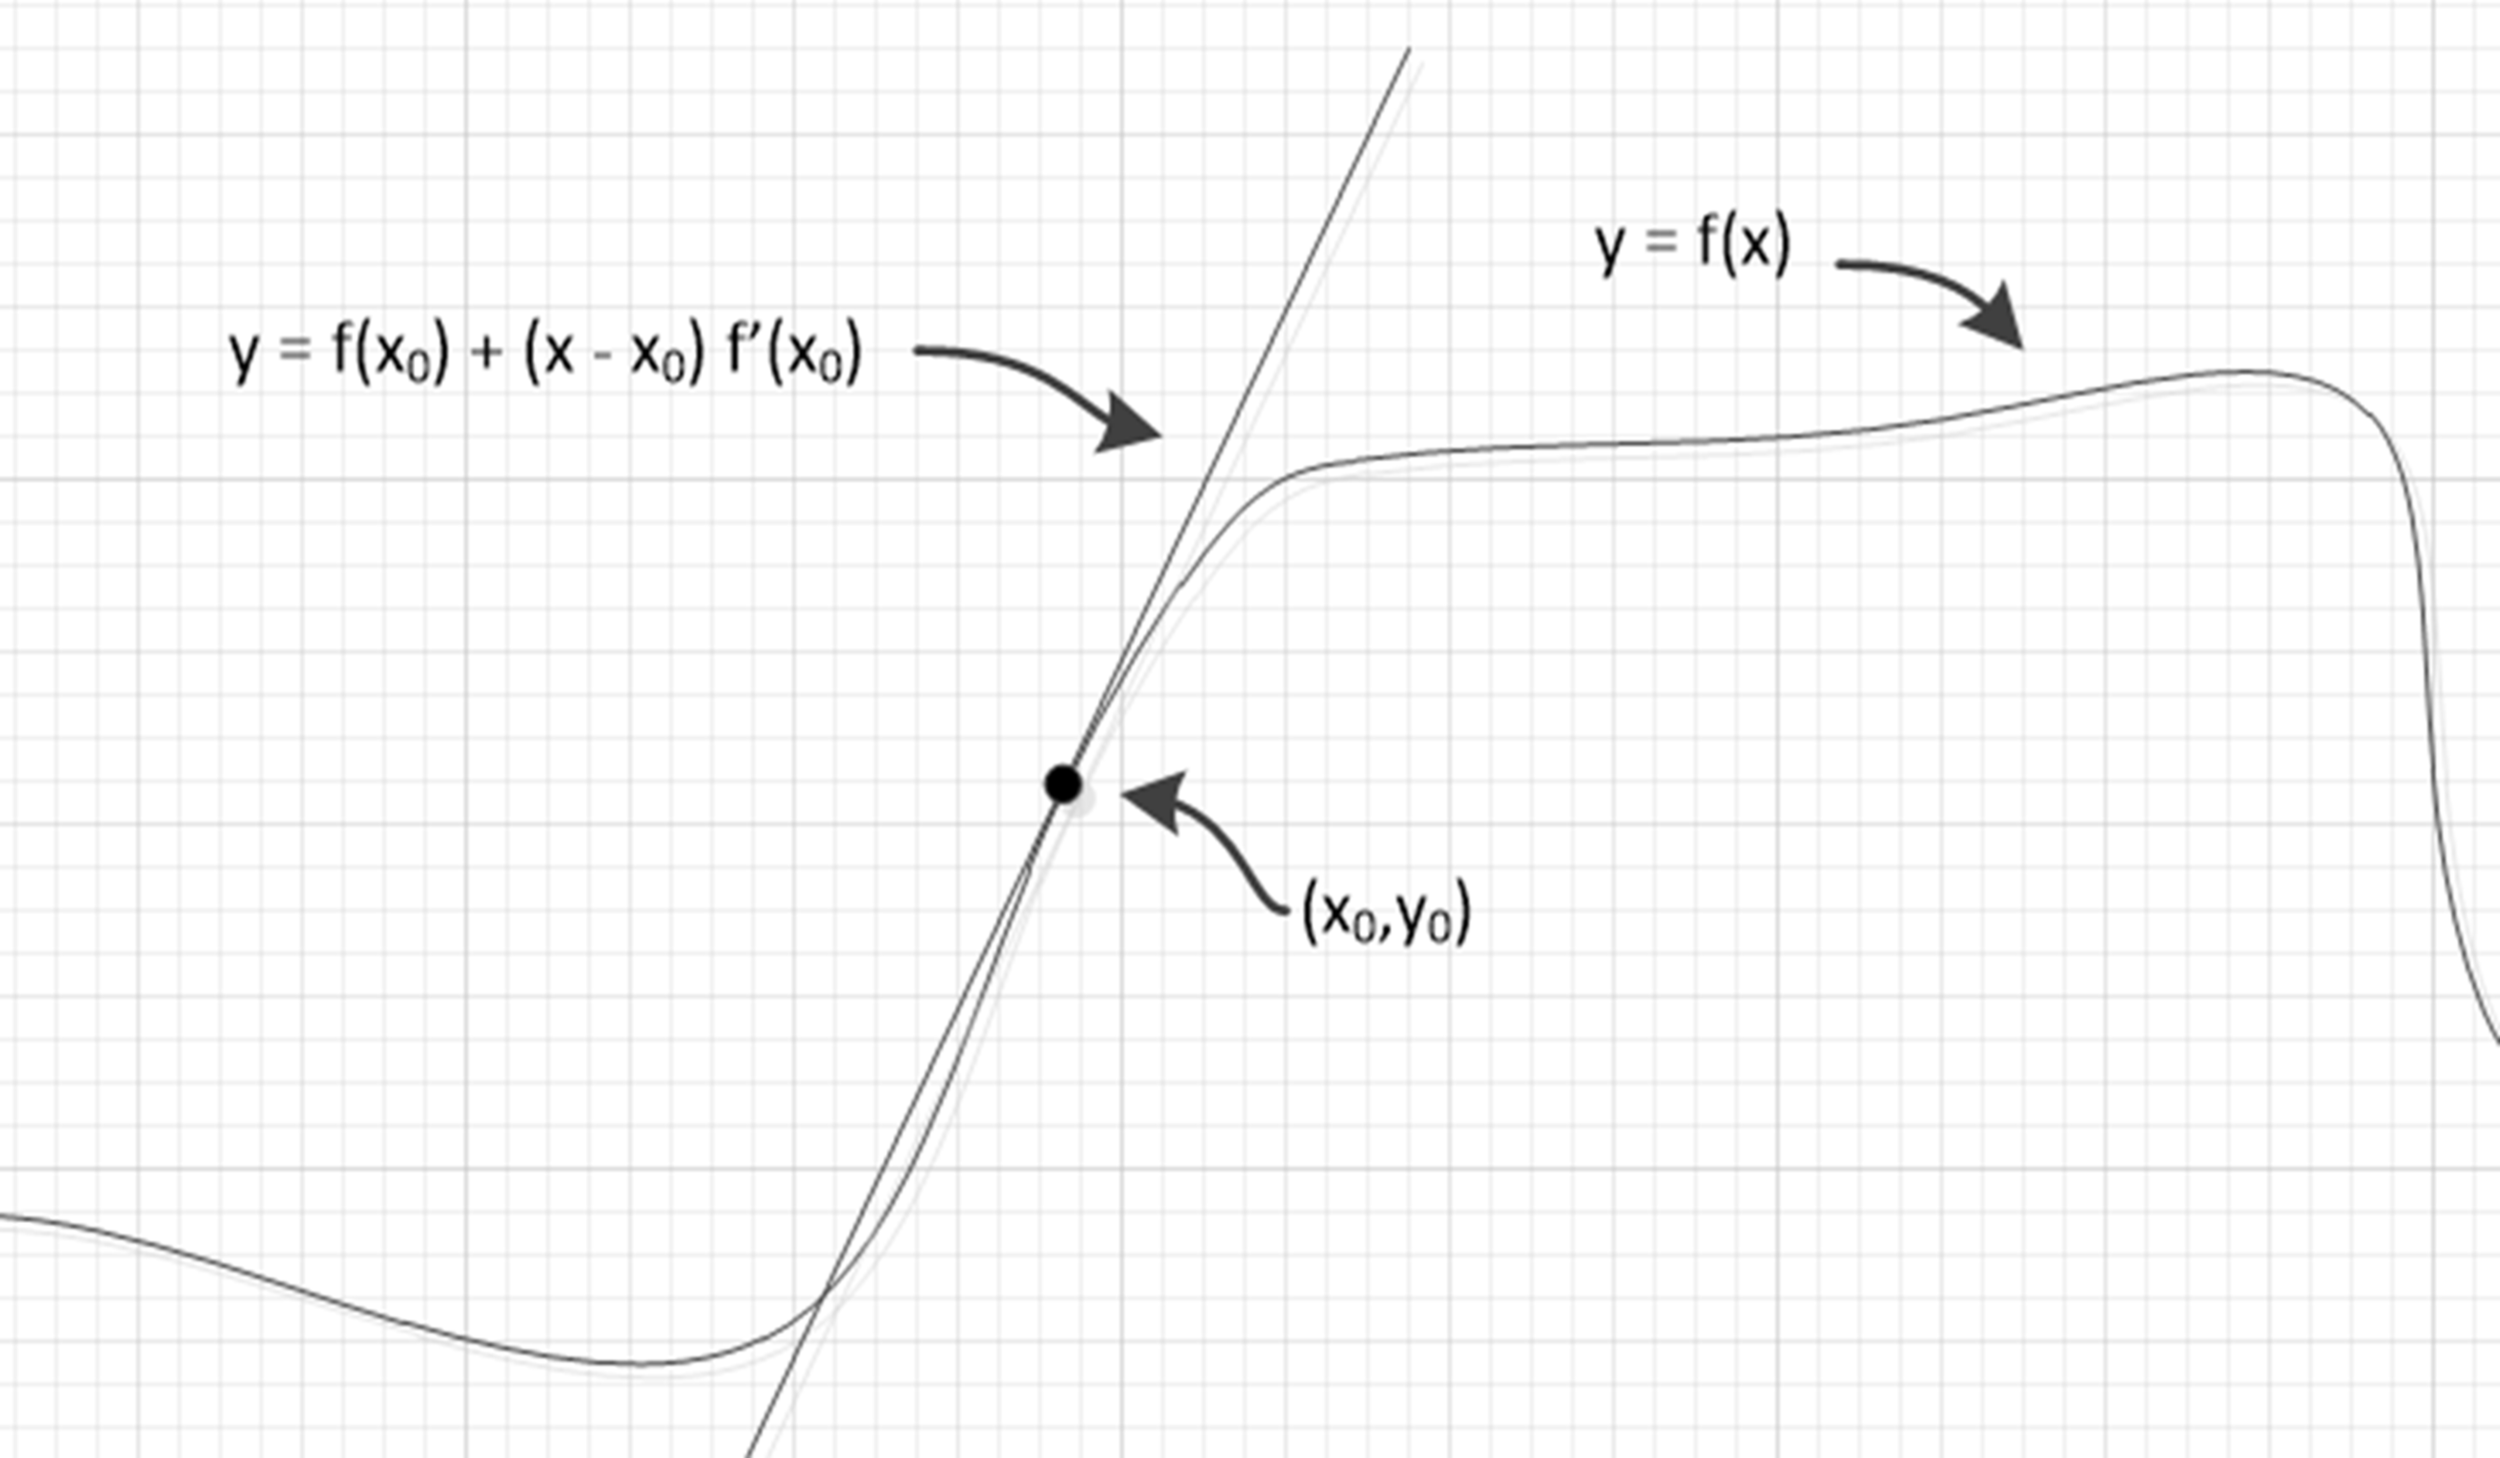
Here’s a picture for those readers who might have learned and remembered a bit of calculus: you can use a straight line to approximate a continuous function f(x) that has bends and curves, at least locally. If you focus your attention on the local neighborhood of the point (x0,y0), a straight line is a good and simple summary of how y changes with x. What’s calculus got to do with work-place improvement?
Why simple tools often suffice if we can focus attention
In a current project, I am working with managers and staff in an intensive care unit to improve performance guided by a set of measures. We have both daily and weekly data to inform our effort. While the work is challenging, it is far easier than trying to improve performance of the entire hospital with only monthly data!
When you focus your analysis on a subsystem, the subsystem will never be more complex than the original system. The subsystem will be simpler: in our case, just 12 beds, with a limited number of staff, frequent observations, over the past five months.
A simpler causal system and its problems can be analyzed and understood using simpler tools.
For example, Taiichi Ohno advised us to go observe the work directly when problem-solving. In other words, focus in time and space on the situation. Ohno believed that our eyes and other senses are often enough to develop understanding of problem causes and to lead to changes that will prevent problem recurrence. Ohno’s disdain for statistical methods arises from the widening of focus that can accompany collection of numbers and reports, with concurrent delays between a problem’s occurrence and its report. Ohno wanted us to avoid unnecessary complexity and reduce problem-solving cycle time.
One step up from Ohno-style direct observation, we have basic analytic tools. Plots of data in time order, process flow diagrams, Pareto charts and stratification make elusive phenomena easier to grasp. For example, in our hospital project, the unit team wants to reduce relatively rare infections. Plotting ‘infection-free days’ helps them understand if the changes they are making lead to fewer infections.
If the ICU managers and staff can analyze problems themselves, local knowledge of their system enhanced by simple analytic tools will frequently lead to solutions that can elude more sophisticated analyses by outsiders. Management practices like regular huddles and process audits can then help the ICU team hold the gains and tackle new issues.
Seven Basic QC Tools
Kaoru Ishikawa in Introduction to Quality Control, Tokyo: 3A Corporation, 1989, listed seven introductory level tools:
1. Pareto diagrams
2. Cause-and-effect diagrams
3. The idea of stratification
4. Check sheets
5. Histograms and frequency distributions
6. Scatter diagrams
7. Graphs and control charts
Ishikawa said that these Seven QC tools, aimed at everyone in an organization, “…if used skillfully, will enable 95% of workplace problems to be solved.” (Introduction to Quality Control, p. 94).
Note that Ishikawa talked about workplace problems, a narrow subset of problems in our world. We need far more sophisticated methods to try to understand and solve problems in large and complex social and physical systems.

