


Once Again, You Can Often See A lot Just By Looking
Two map-makers got together in Florida a few years ago to compare maps of Gainsville, Florida. What they saw drove them to make changes to improve health and reduce the likelihood of abuse and neglect in specific Gainsville neighborhoods.
The story on NPR (aired 10 March 2015) describes how Dr. Nancy Hardt collaborated with Alachua County Sheriff Sadie Darnell. They compared a map of children born in poverty in Gainesville with maps of child abuse/neglect and domestic violence. We clipped the maps from the NPR site so you can see the patterns yourself.
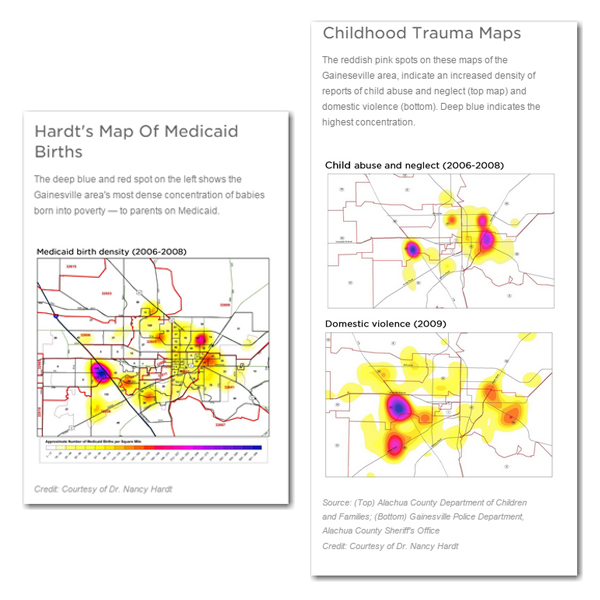
The overlap is striking and generated several change ideas, including a bus-based clinic and, most recently, a multi-function health and community center.
Dr. Hardt and Sheriff Darnell--“subject matter experts” – used the maps to catalyze their thinking and to inspire plausible changes that aim to improve community health.
The interventions to date match small improvement in the rate of domestic violence and abuse. Of course, a careful analysis will try to disentangle the effects of the specific changes from general “secular” changes in domestic violence and abuse. Nonetheless, when key community leaders engage with data, watch trends, and experiment with ways to improve community health, they can learn relatively quickly about what works and what doesn’t.
With publicly available data and modern data tools, it’s easy to make maps like those from Gainesville using our favorite R-based tools—see for example this blog post. I got inspired today and will be making some maps for a current project—maybe you will, too.

