


Bumping Up Against Assumptions: Learning to Enjoy Code Errors
At this point in my career, it makes sense for me to outsource data analysis and display application development to people who have more skills, work faster, and charge less per hour than I charge my clients.
In fact, I rely on a couple of colleagues exactly for that kind of help to extend my work or replace it entirely.
Nonetheless five years ago, I decided to learn to write applications in the R language. While R is idiosyncratic and appears to annoy some developers schooled in other languages, R has a rich ecosystem of tools, an enthusiastic global user community and it is a real language. It enables users to create all kinds of analyses and displays.
In addition to solving problems and building displays for my clients, I get an enormous benefit from writing applications: the opportunity to practice Plan-Do-Study-Act thinking while working in my office.
An R script, a set of instructions to manipulate data to yield a summary analysis or graph, is a plan. The plan has a prediction: given the inputs, we will get desired outputs. Run the script (do), then study the results and decide what to do next—accept the script as is as “good enough”, adjust the script to get desired results, or abandon the script completely and choose a different approach.
Of course, predictions always are contingent on assumptions, either explicit or hidden. In an R script, the assumptions are expressed in the script’s environment, which consists of data objects and functions that I’ve created or found in other R packages.
I’ve learned enough over the last five years to enjoy most bug-finding exercises, at least when I’m not under severe time pressure to fix the application.
Why? There’s an element of surprise when a prediction fails—it’s a wake up call to your brain (see these posts:
The logic of an analysis, operationalized in the script, produces desired results given a specific environment of inputs and supporting R libraries.
If you spend enough time, you usually can create an application that will function in a range of environments. That’s the issue—there’s always a tradeoff between speed to develop a script to get something and making the application robust to a range of environments.
If the environment actually present doesn’t sufficiently match the environment I originally had in mind, R may respond with an error message. Or, the script may run without an explicit error message but the result of the script is simply wrong.
Example
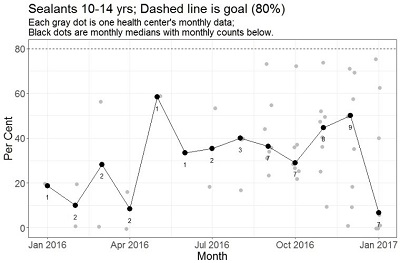
I had an instance of the “script runs but result is wrong” last month. I displayed the performance of several dental clinics month by month; for example, I wanted a graph to show the per cent of eligible kids getting sealants to prevent tooth decay.
The overlay plot was supposed to show the number of clinics reporting each month, just underneath the median performance. When I ran the code, I got the result shown here: The median plot (black dots) looked right but the count was clearly wrong.

The order of the grey dots and the median dots were both correct but my counts were in order of the unique month labels found in an intermediate data table. If the first health center in the intermediate table has a complete time series for the performance measure to be plotted (the situation in the first graph example I tested) all would be well. But that is not the case for data related to Sealants for 10-14 year old patients. I need to allow for incomplete data series across the measures and health centers in our project.
Documenting Study and Act Steps
To write R applications, I use RStudio, the popular integrated development environment. RStudio integrates with the version control system GitHub. Once I found the error, it was easy to document the change and move on to other problems: line 436 shows the change (red==old, green==new), along with the message in the “Commit message” box. Now I have a record of the need to adjust my assumption about date order and the corrected script. Very neat!


