


Causal Diagrams: What’s Missing Carries Weight

In my last post, I described how causal diagrams expressed as Directed Acyclic Graphs (DAGs) differ from other causal pictures.
I omitted a critical difference, emphasized by Felix Elwert in his 2013 introduction to graphical causal models:
“DAGs encode the analyst’s qualitative causal assumptions about the data generating process in the population. But in contrast to conventional social theory, which focuses on justifying what relationships do exist, DAGs insistently redirect the analyst’s attention to justifying what arrows do not exist. Present arrows represent the analyst’s ignorance. Missing arrows, by contrast, represent definitive claims of knowledge. It is the missing arrows—“exclusion restrictions” in the language of economics—that enable the identification of a causal effect. Adding arrows to an existing set of variables in a DAG (i.e., relaxing exclusion restrictions) never aids nonparametric identification.”
(Elwert, Felix. 2013. “Graphical Causal Models.” Pp. 245-273 in S.L. Morgan (ed.), Handbook of Causal Analysis for Social Research. New York: Sage Publications.)
As Elwert explained in a 2013 presentation available here, arrows included in a causal DAG propose a potential causal effect that may range from strong to vanishingly small.
On the other hand, a missing arrow between two nodes implies absolutely no causal effect. That’s a strong claim!
For example, take a look at figure 3.6 from the birth weight paradox paper cited in last week’s post.
This model proposes no causal effect of low birth weight on infant mortality.
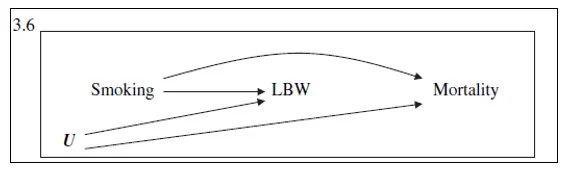
Association of low birth weight and mortality, according to this model, arises from the common causes of smoking and a collection of unmeasured risk factors U. The association is not causal, rather just an instance of ‘correlation does not mean causation’. This DAG and its missing arrow set the stage for substantive discussion of causes of infant mortality and relevant data analysis.
A note on the picture
The picture at the top of this post, the left panel of the Pine Trees Screen by Hasegawa Tohaku, illustrates the Wikipedia entry for the Japanese concept of Ma (negative space). Ma, the ‘simultaneous awareness of form and non-form deriving from an intensification of vision’ seems like a good summary of how to read a causal DAG, looking at both the arrows that are there and the arrows that are not.

